EcoBoilers » Cutting your heating costs
Dear Page Visitor: If you are reaching this page, the page forwarding function is not working properly. This page is the only active page on an old web site. Please go to our new home page and navigate from there.
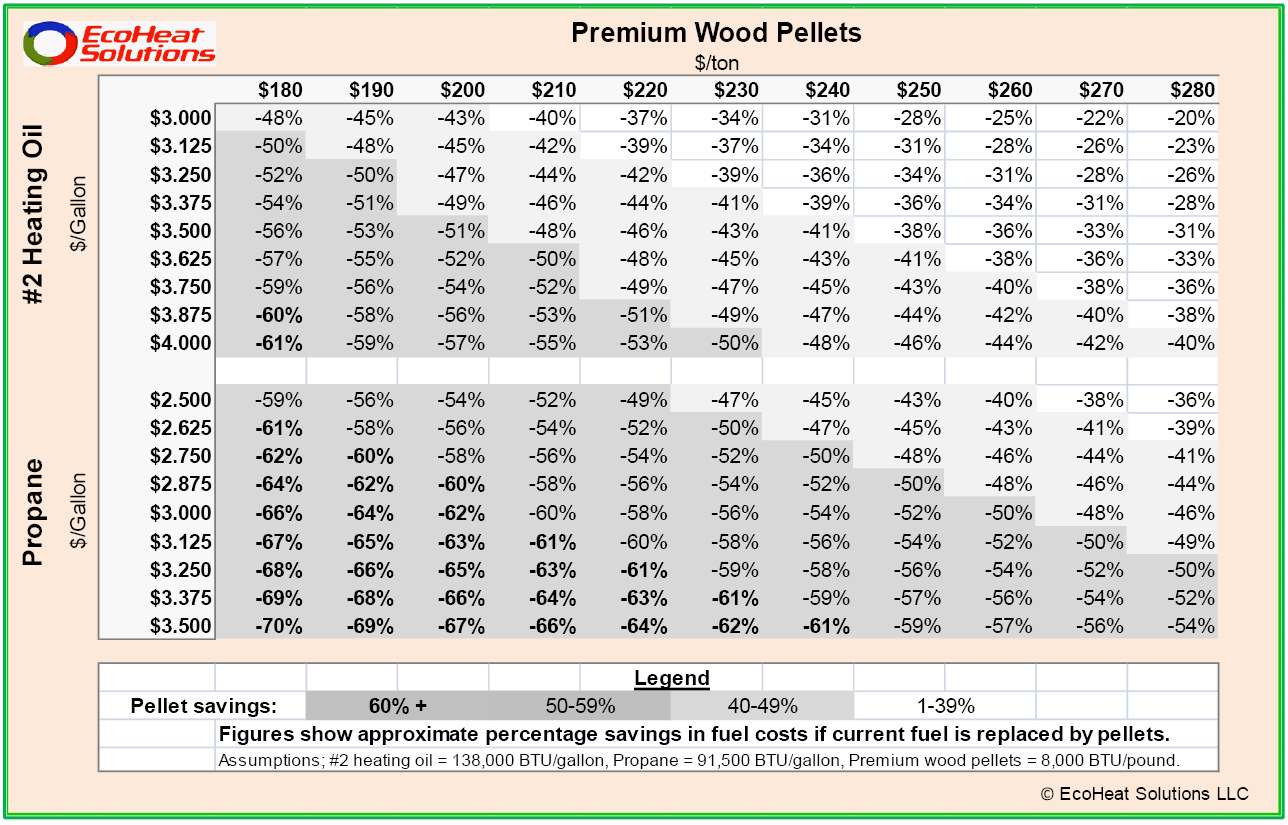
Compare Heating Costs
The best way to evaluate the economic impact of the heating alternatives available to you is with a side-by-side comparison. That's what you'll find in these two charts. The first chart shows how much you can save by switching to wood pellets. Multiply your current heating bills by the percentage to find your approximate savings. In the second chart, fuel costs for a typical American home in the "heating belt". The annual energy demand for heat and hot water for the home in this example is 110 million BTUs, net of system inefficiencies.You can see the savings are significant simply by changing fuels.
| EcoBoiler Pellet Boiler | #2 Heating Oil | Propane | Geothermal Heat Pump | Electric Heat | |
| Energy Delivered (Btu) (1) | 1,000,000 | 1,000,000 | 1,000,000 | 1,000,000 | 1,000,000 |
| Price for Fuel (2) | $225/ton | $3.90/gallon | $3.40/gallon | $0.176/kWh | $0.176/kWh |
| Annualized efficiency (3) | 82% | 82% | 90% | 222% | 100% |
| Fuel use per million BTU delivered (4) | 153 lbs | 8.8 gallons | 12.1 gallons | 132 kWh | 293 kWh |
| "Typical" annual cost for fuel (5) | $1,950 | $3,900 | $5,677 | $3,206 | $7,116 |
| Net Fuel cost per million BTU delivered (6) | $17.21 | $34.32 | $41.14 | $23.23 | $51.58 |
| EcoBoiler Fuel Cost Savings | - | 50% | 58% | 26% | 67% |
Comparisons are made on a cost per unit of usable energy, in this case million BTUs (MMBtu). Multiply your fuel costs by the percentage of estimated fuel cost savings for a rough estimate of your cost savings at today's prices. Heating oil prices on the east coast have increased an average of 12.3% for 13 years running, while propane prices have increased an average of 9.2% over that time span.
For an evaluation of your situation, including equipment costs, plus installation and payback estimates, please contact EcoHeat Solutions.
- Because boilers are less than 100% efficient, more energy is needed in the form of purchased fuel. Therefore, the energy content of the fuel consumed is higher than is actually delivered to the space in the form of heat. The figures in the table take these efficiencies into account so you get a true apples to apples comparison of heating systems. Because geothermal heat pumps are more than 100% efficient, less energy is purchased than is delivered by the heat pump, with the remaining energy coming from the ground. Typical annual efficiencies for new systems are accounted for in the table.
- These values are East Coast averages for December 19, 2011. Fossil fuel pricing obtained from the Energy Information Administration. These values are updated periodically.
Pellets: Lowest of two online wood pellet vendors located in Massachusetts.
#2 Heating Oil: http://tonto.eia.doe.gov/dnav/pet/pet_pri_wfr_a_EPD2F_PRS_cpgal_w.htm
Propane: http://tonto.eia.doe.gov/dnav/ng/hist/n3010ma3m.htm
Electricity: http://www.eia.doe.gov/cneaf/electricity/epm/table5_6_b.html - Seasonal efficiencies are typical values for new systems. Efficiencies published by manufacturers in their marketing materials are often higher, and they represent efficiencies under ideal, steady operating conditions, not the cycling on and off that typically occurs many times every day during the course of a heating season. Cycling on and off lowers the efficiency of the heating system.
- These values across this row are all equivalent energy values, and factor in differences in the system efficiencies noted on the previous line. The energy content of the various fuels before accounting for efficiencies are:
Pellets: 16.4 million BTU/ton
#2 Heating Oil: 138,000 BTU/gallon
Propane: 91,690 BTU/gallon
Electricity: 3,412 BTU/kWh - These values use Gross 138 million BTU/year as a "typical" example. Your demand for energy to heat your home will vary from these values, although the fuel costs will be likely be in proportion if you live on the east coast..
- This is an apples to apples comparison of the annual cost of energy divided by the annual energy consumption, factoring in system inefficiencies, and converting into MMBtu (cost per million BTUs).